

Skip to content
Peakyas
EN
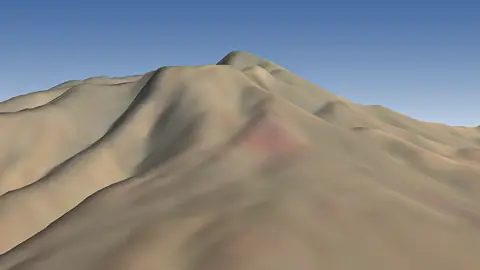
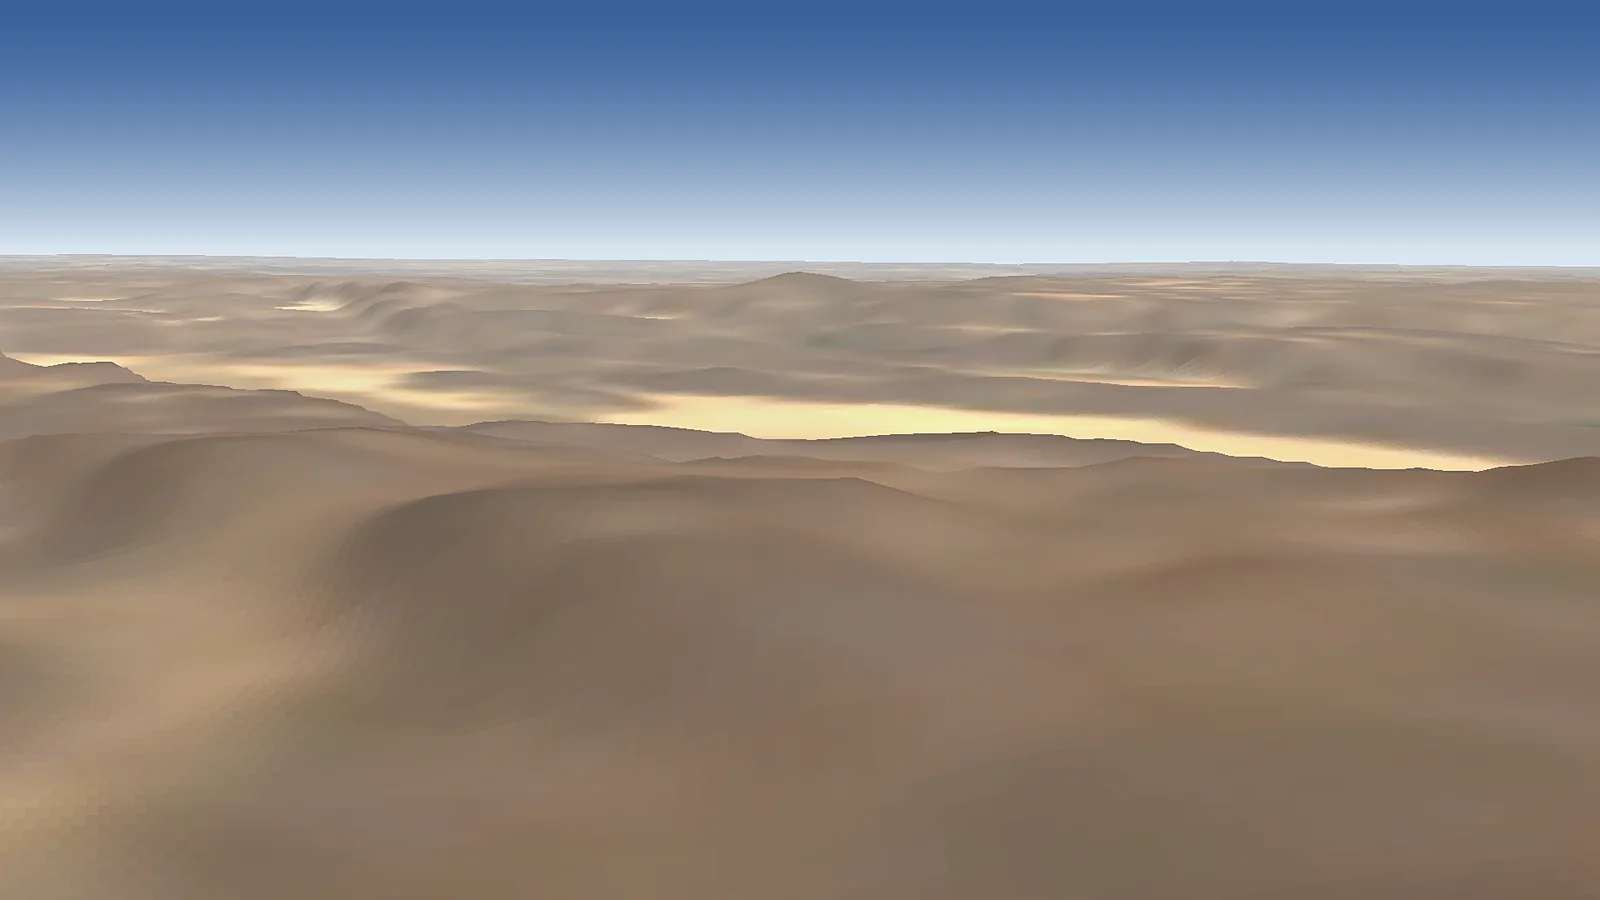
Manda-Inakir in 3D: real relief (Copernicus DEM) and satellite image (Sentinel-2)

Mountain·DjiboutiEritreaEthiopiaDjibouti / Eritrea / Ethiopia

Manda-Inakir

600m

Summit weather

3D view drawn from Copernicus WorldDEM-30 (© DLR e.V., © Airbus Defence and Space GmbH, Copernicus/ESA) and Sentinel-2 cloudless 2016 by EOX IT Services GmbH, CC BY 4.0

Elevation
600m
Relief
132mabove the lowest point within 5 km
Steepest slope
17°within 1 km of the summit
Snow at the summit
NoneSee month by month ↓
Summit
12.6308°N, 42.3353°E

Mountain in Eritrea

Manda-Inakir is a mountain in Djibouti. Its summit stands 600 m above sea level.

From the lowest point within 5 km (468 m), it rises 132 m.

Read more on Wikipedia

Scores

Manda-Inakir for skiers and climbers

Two scores out of 10, built only from open data — every part is shown. They describe what the mountain offers, not how safe it is.

Hiking & mountaineering

2.5/10

Difficulty to the top

Hike

Estimated from the slope: OpenStreetMap has no graded paths near the top.

Indicative only — never a safety assessment. Conditions change: ask local guides and check the forecast.

  • 0.0/2.50 waymarked routes and 0 path sections nearby
  • 0.0/1.50 huts and shelters
  • 0.1/2132 m of ascent from the valley
  • 0.8/1.579 m of prominence
  • 1.5/1.512 months with summit afternoons above −5 °C
  • 0.0/1via ferratas, climbing and glaciers
Ski score

—

No ski runs within 12 km in OpenStreetMap.

How these scores are made

Ski (where OpenStreetMap has skiing within 12 km): up to 4 points for the length of downhill runs (300 km or more = 4), 1.5 for the number of lifts (40+), 1.5 for the vertical between lift stations (1,500 m) and 3 for the snow season — a month counts when the estimated mean temperature at the height of the ski area is −1 °C or lower and snow falls or lies there (NASA POWER, 2001–2020). Hiking & mountaineering: up to 2.5 for waymarked routes and paths, 1.5 for huts, 2 for the ascent from the valley (2,000 m), 1.5 for prominence (3,000 m), 1.5 for the season (months with summit afternoons above −5 °C) and 1 for via ferratas, climbing and glaciers. OpenStreetMap is built by volunteers: where few things are mapped, a score can be lower than reality.

Plan your visit

Stay, climb and get there

Some links above are affiliate links: if you book through them we may earn a commission, at no extra cost to you. It never changes what the data on this page says.

Snow

When there is snow on Manda-Inakir

In a normal year there is no snow on this mountain, not even at the summit.

Estimate for a normal year: average temperature and precipitation from NASA POWER, carried to each height, in a simple model of snow building up and melting. In a given year snow can come earlier or stay longer. It does not replace the local snow and avalanche bulletin.

Summit weather

Manda-Inakir, month by month

Not a forecast: long-term averages (1991–2020), carried up to the summit. The orange line is where an average afternoon reaches 0 °C; above the dashed blue line it freezes even at dawn.

On an average June afternoon the summit reaches about 39 °C; on January nights it falls to about 17 °C. Afternoons at the top are above freezing in every month of the average year. In June the 0 °C line climbs to about 8,400 m, above the summit: the top thaws on an average afternoon. Across the region, November is the driest month (6 mm) and August the wettest (61 mm).

2,000 m4,000 m6,000 m8,000 mSUMMIT · 600 mJanuary: 6,420 mFebruary: 6,700 mMarch: 7,160 mApril: 7,540 mMay: 8,080 mJune: 8,400 mJuly: 8,080 mAugust: 7,840 mSeptember: 7,900 mOctober: 7,460 mNovember: 6,920 mDecember: 6,520 mJanFebMarAprMayJunJulAugSepOctNovDec
0 °C on an average afternoon 0 °C at dawn the summit
MonthSummit high °CSummit low °C0 °C line (m)Rain & snow (mm)Wet daysSun h/day
January29176,420628.6
February30176,700629.2
March33197,1601669.7
April35217,54050810.0
May37248,08031710.1
June39268,4001639.5
July37268,08048128.3
August36267,84061158.3
September36257,9004798.6
October34227,4601759.8
November32196,920629.7
December30176,5201329.2

Estimate: the NASA POWER climate of a ~55 km cell (average height 463 m), adjusted to the summit by −6.5 °C per 1,000 m. Rain, wet days and sunshine are those of the region. Mountain weather changes fast — always check a local forecast. ★ = mildest months at the top.

Relief

The mountain in profile

Two cuts through the summit, 16 km long, from the 30 m Copernicus elevation model. Heights drawn 18× taller than lengths, so the shape can be seen.

West – east
600 m501 m0 km2 km4 km6 km8 km10 km12 km14 km16 kmWE
South – north
600 m439 m0 km2 km4 km6 km8 km10 km12 km14 km16 kmSN
Steepness by direction
30°N: 3°NNE: 2°NEE: 2°ESE: 2°SES: 5°SSW: 6°SWW: 3°WNW: 3°NW

Average slope of the first kilometre from the summit. The orange petal is the steepest side.

Around the mountain

Huts, lifts and trails around Manda-Inakir

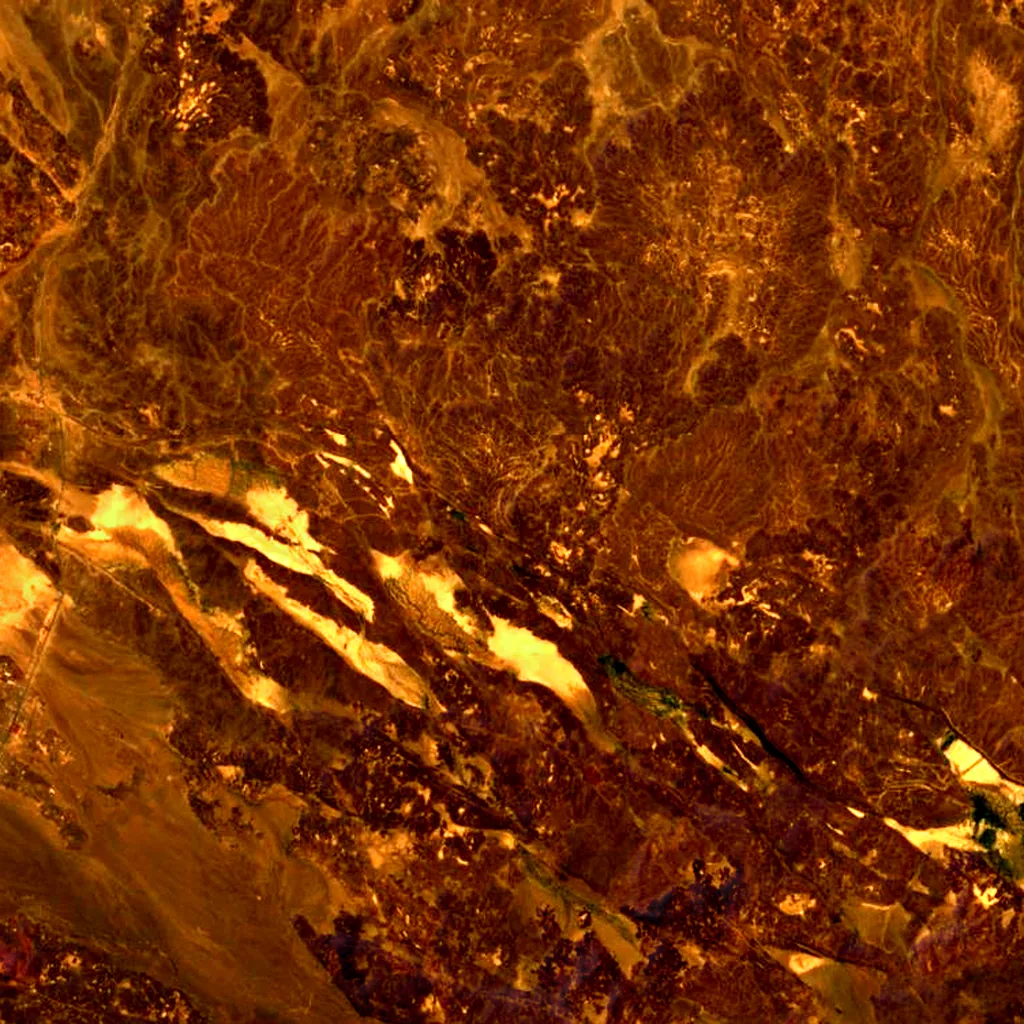
Counted around the summit in OpenStreetMap, the map anyone can edit. The satellite plate shows 14 × 14 km.

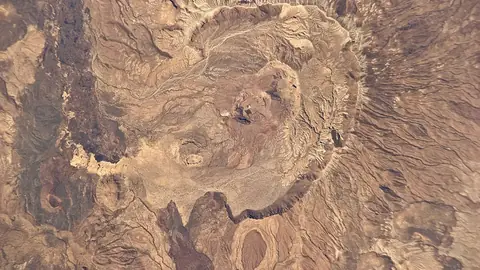
Manda-Inakir seen from above (Sentinel-2) N 5 km

Sentinel-2 cloudless 2016 (EOX, CC BY 4.0), 14 × 14 km, north up. Points © OpenStreetMap contributors.

  • —mountain huts and shelters
  • —cable cars, gondolas, chairlifts and rack railways
  • —ski areas
  • —waymarked hiking routes
  • —via ferratas
  • —climbing crags and routes
  • —named glaciers
  • —viewpoints
  • —campsites
  • —hotels, B&Bs and chalets
  • —restaurants and cafés

OpenStreetMap is built by volunteers: a low number may just mean nobody has mapped it yet. Places © OpenStreetMap contributors (ODbL).

Recent years

How each month compared at the summit

Afternoon high at the summit (estimate). The first row is the reference, the 1991–2020 average in °C; the years show only the difference.

JanFebMarAprMayJunJulAugSepOctNovDec
1991–2020 average293033353739373636343230
2020+0.2+0.3+0.2−0.3+0.6−0.3−2.0−1.2−0.1+1.7+0.1+0.5
2021−0.3−0.4+0.3+0.1+1.3+1.4−3.1−1.9−1.7−0.5+1.3+0.3
2022+0.1+0.9±0.0+1.3+2.7+0.2−2.6−4.2−1.3+0.2+0.4+0.4
2023+0.4+1.2−1.3−0.8−1.0−0.1+2.5+2.4+2.7+0.6+0.5+1.3
2024+1.8+1.8+1.1+1.3+0.9+2.2+0.5−3.1+0.4+0.4+0.4+0.9
2025+0.4+0.4−0.1+1.4+1.5+1.5+2.1−2.6−1.7−0.8−0.8+0.4

+1 warmer than usual −1 cooler than usual

About these numbers

Names, elevation, prominenceWikidata (Q3285402) · CC0
Relief, 3D view, profilesCopernicus DEM GLO-30 · © DLR e.V., © Airbus Defence and Space GmbH, Copernicus/ESA
ClimateNASA POWER, 1991–2020 · CC BY 4.0
Around the mountain© OpenStreetMap contributors · ODbL
ImagesEOX Sentinel-2 cloudless 2016 · CC BY 4.0; Wikimedia Commons

Every figure is an average, an estimate or a count from a public dataset. Licences and methods: data sources.

The family

Do you prefer beaches, lakes, mountains, waterfalls, islands, rivers or canyons?

Same idea, other landscapes: field atlases built on open data, month by month, in seven languages.

beachesCoastyaFind your beach: sea temperature, sun and swimming month by month.Visit
lakesLakeyasEvery lake on Earth: water temperature, ice, depth and the shore.Coming soonVisit
mountainsPeakyasEvery summit in 3D: summit weather, the 0 °C line, huts and trails.You are here
waterfallsCascadyasEvery waterfall: height, flow month by month and when it roars.Coming soonVisit
islandsIslandyasEvery island from the sea up: size, sea temperature, ferries and 3D.Coming soonVisit
riversRiveryasEvery river from source to sea: the journey, the flow and the basin in numbers.Coming soonVisit
canyonsCanyonyasEvery canyon cut to scale: depth to the floor, rim and floor temperatures, trails and viewpoints.Coming soonVisit